THIS SOLUTION IS NO LONGER SUPPORTED AND WILL BE UPDATED TO SOLUTION USING SNMP AND INFLUXDB AS STORAGE. ALSO NOTE THAT CHARTJS HERE CONTAINS VULNERABILITY, YOU SHOULD USE MAINSTREAM CHARTJS.
MikroTik traffic stats and counter
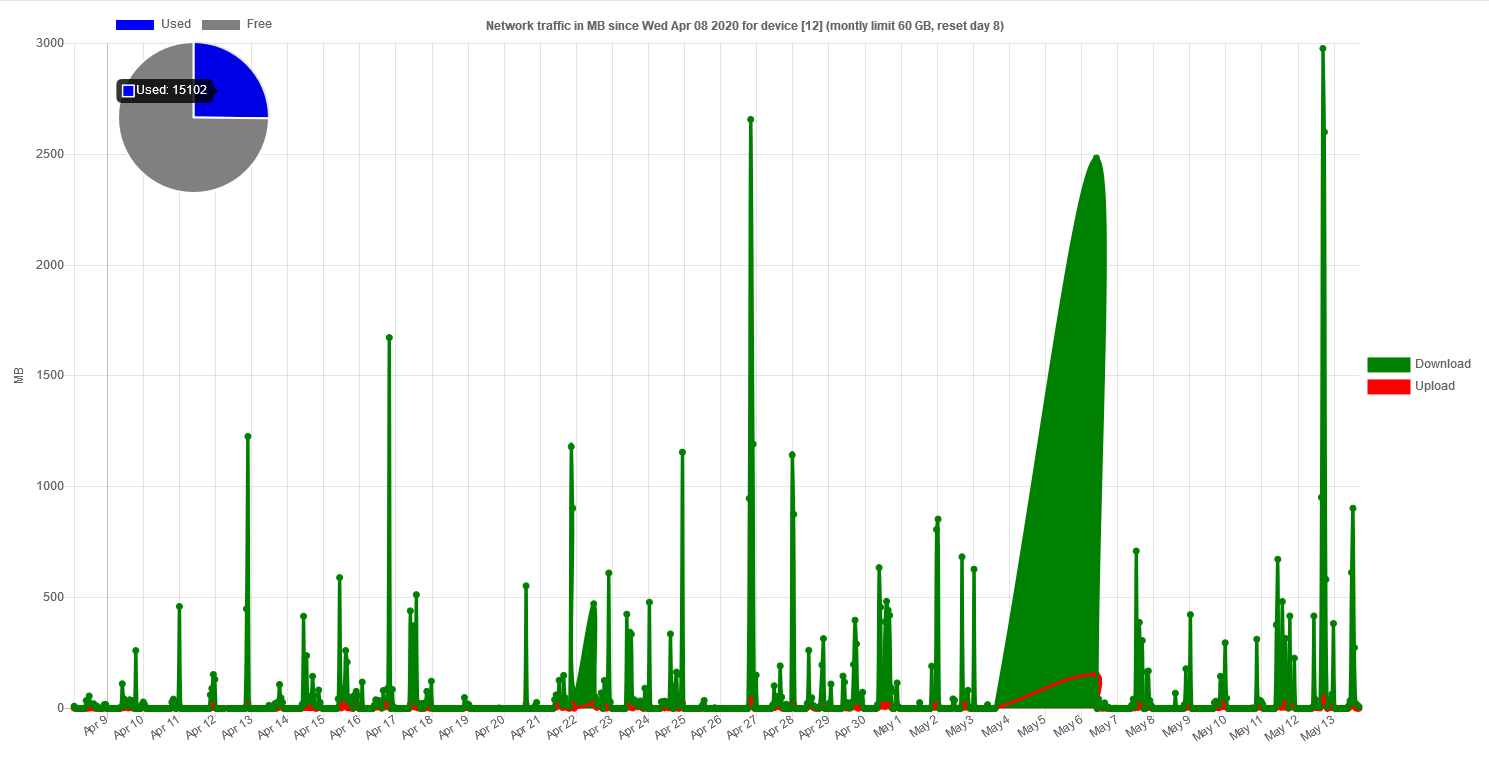
This is a set of files to collect network traffic from a Mikrotik device and to display the data in a nice graph. The graph also shows monthly data usage, e.g. if you have a monthly data plan.
Mikrotik sends the data via HTTP(S) to your own web server (e.g. Nginx) where the data is stored and processed via Perl scripts. Collection of HTML/Javascript then shows the data in a graph.
What's included:
- scripts for MikroTik to send data
- empty SQLite database to store data
- Nginx configuration file
- Perl scripts to collect and process data
- HTML/Javascript to show the graph
Perl script stores data for up to last 2 months. Older data is automatically removed.
The graph shows data (roughly) for the last month.
It is possible to track data for multiple devices, just make sure you set unique YOUR_DEVICE_ID for each device (see installation).
In the index.html file you can modify two constants:
start = day of the month when the monthly limit resets
limit = montly traffic limit in GB
- Configure a web server (see sample Nginx configuration).
- Put the Perl scripts and SQLite database inside the cgi-bin directory.
The .sqlite database must be placed together with .pl files or modify the path to SQLite in the Perl script.
- Put the HTML files inside the www root directory.
You can put the HTML/Javascript files anywhere inside your www root, e.g. you can place all files inside /var/www/html/mikrotik.
- Copy the MikroTik script to your device. There are two alternatives how to obtain traffic stats in MikroTik. Use either way.
Directly via interface:
{
:local txbyte [/interface ethernet get ether1 value-name=tx-bytes]
:local rxbyte [/interface ethernet get ether1 value-name=rx-bytes]
/tool fetch url="YOUR_SERVER_URL/mtstore.pl?id=YOUR_DEVICE_ID&tx=$txbyte&rx=$rxbyte" mode=https keep-result=no
}
Using mangle rules:
/ip firewall mangle add chain=forward out-interface=ether1 action=passthrough comment=tx-wan
/ip firewall mangle add chain=forward in-interface=ether1 action=passthrough comment=rx-wan
Script if using mangle rules:
{
:local txbyte [/ip firewall mangle get [/ip firewall mangle find comment="tx-wan"] bytes]
:local rxbyte [/ip firewall mangle get [/ip firewall mangle find comment="rx-wan"] bytes]
/tool fetch url="YOUR_SERVER_URL/mtstore.pl?id=YOUR_DEVICE_ID&tx=$txbyte&rx=$rxbyte" mode=https keep-result=no
}
Both examples use ether1 as interface name. Change accordingly to your needs.
Make sure you replace YOUR_SERVER_URL with your webserver URL and YOUR_DEVICE_ID with any number. The ID is just a number to identity the device.
- Set schedule on your MikroTik device to fire the script regularly (e.g. hourly).
- Point your browser to the graph.
Assuming you placed all files in "mikrotik" directory the URL is:
http(s)://YOUR_SERVER_URL/mikrotik/index.html?id=YOUR_DEVICE_ID
That's it!
